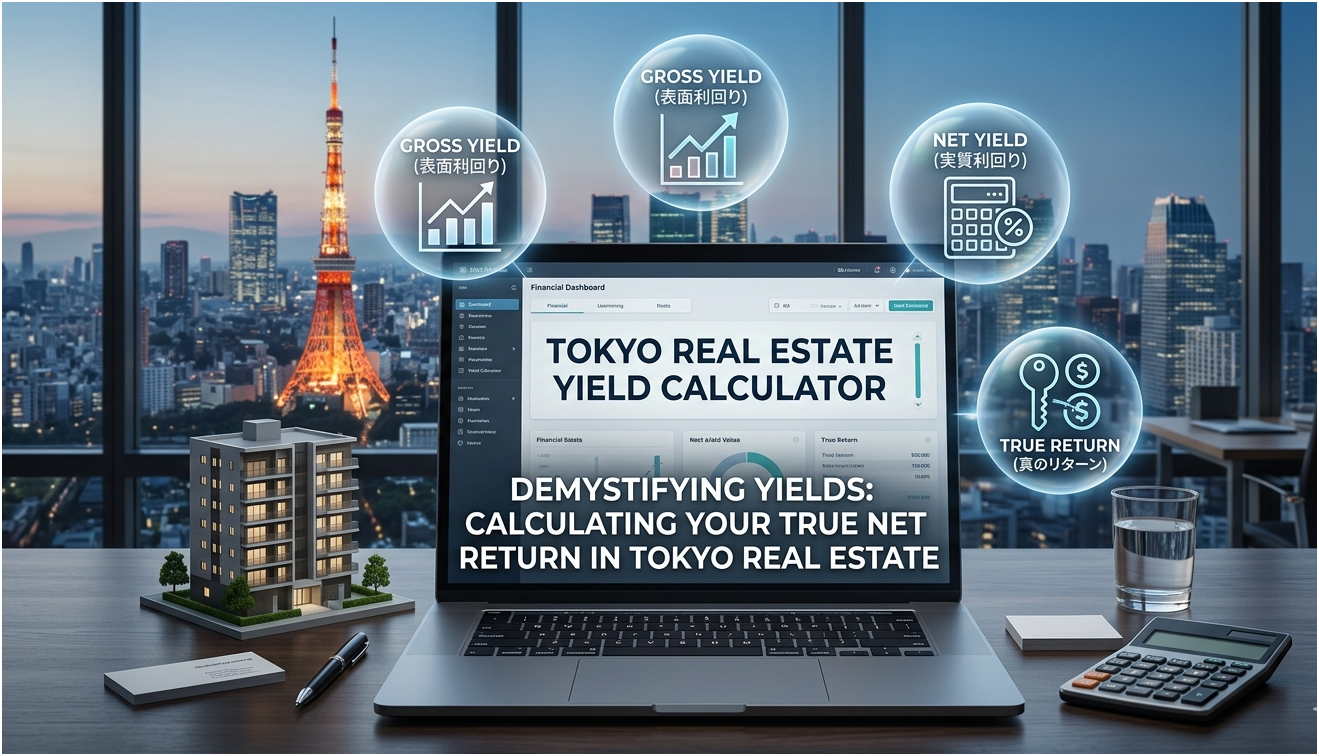
15. Demystifying Yields: Calculating Your True Net Return in Tokyo Real Estate
15: Demystifying Yields: Calculating Your True Net Return in Tokyo Real Estate
When browsing Tokyo property listings, it is easy to get caught up in the "Gross Yield" (表面利回り) displayed on marketing materials. However, prudent global investors know that the only number that truly matters is the Net Yield (実質利回り)—your actual return after all expenses are deducted.
Let’s look at a realistic cash flow simulation to understand what your actual "take-home" income looks like in the Tokyo market.
Hypothetical Case Study:
Property Type: Pre-owned studio apartment in Tokyo’s 23 Wards
Purchase Price: ¥30,000,000
Gross Yield: Approx. 4.5% (Annual Rental Income: ¥1,350,000)
From this gross income, you must account for the following standard operating expenses:
Building Management & Repair Reserve Fees (Kanri-hi / Shuzen-tsumitate-kin): Monthly fees paid to the building’s homeowners association to maintain the property’s structural integrity and common areas (Approx. ¥180,000 – ¥240,000 annually).
Property Management Fee: The fee paid to your PM company for tenant relations (Typically around 5% of monthly rent + consumption tax / Approx. ¥75,000 annually).
Property & City Planning Taxes (Koto-zei): Annual holding taxes paid to the local government (Approx. ¥50,000 – ¥80,000 annually).
After deducting all these running costs (totaling roughly ¥350,000 to ¥400,000 per year), we reach the real figure:
True Net Yield: Approx. 3.2% to 3.4%
Actual Net Income (Cash Flow): Approx. ¥950,000 – ¥1,000,000 per year.
Compared to some higher-yield, high-risk emerging markets, a 3% net return might seem modest at first glance. However, Tokyo’s true value lies in its unparalleled vacancy safety and the stability of Yen-denominated assets. In Tokyo, you are trading volatile speculation for highly predictable, consistent monthly cash flow.
Curious to see what the true net yield would look like for a specific property you have your eye on? Let’s run the exact numbers together.